Instrumenting Your Code With ActiveSupport Notifications
 Have you ever wondered how tools like New Relic are able to gain valuable metrics to your Rails application's internals? Or maybe you are interested in learning how to write your own libraries and gems so they can be instrumented using those same techniques? Once again the answer is to look deep into the Rails source code – and the answer is
 ActiveSupport::Notifications. A simple and powerful instrumentation API for Ruby available in Rails v3.0 and upward.
Today I want to share a working example of how you might use ActiveSupport::Notifications. Instead of presenting some contrived code, I thought it would be fun to freedom-patch a popular gem so that we can garner supernatural metrics that would have otherwise been lost or hidden deep in our log. For this exercise I have chosen the Subexec gem. Subexec is a simple library that spawns an external command with an optional timeout parameter. It is used by other gems like MiniMagick – a popular minimal replacement for RMagick.
Building Subexec::Notifications
Our goal will be to build a new gem called subexec-notifications that instruments all commands run by the Subexec library. Once completed, third-party subscribers would be able collect these metrics thereby opening up developer/operational insights into how long certain commands were taking and on which server(s).
Lucky for us, the Subexec gem has one interface, the Subexec#run! method. So our work is going to be straight forward. All we have to do is alias method chain that instance method and wrap it with some instrumentation. Assuming you are up to speed on this practice, here is our new implementation.
def run_with_notifications!
  payload = {sub: self, hostname: Socket.gethostname}
  ActiveSupport::Notifications.instrument "subexec.run", payload do
    run_without_notifications!
  end
end
This small snippet of code exemplifies how simple it is to instrument our code. The Notifications instrument class method takes two arguments, a string for the name and an optional payload hash. The name will be used by subscribers and the payload hash can contain anything you want.
Since the Subexec instance has tons of valuable information like the commands output, process id, exit status, and the command string itself - I decided to include it with our payload. The host name is provided with the payload to help us aggregate or subdivide our metrics for each server.
Believe it or not, that pretty much wraps up all that is needed for our new gem's code. Everything else like tests and gem structure are orthogonal to our learning today. But please, browse the entire subexec-notifications gem if you are interested in how it is put together.
Choosing A Metrics Service
So now we have a way to instrument all of our system commands, but how do we collect and view that data? To be honest, your options are incredibly numerous at this point. While learning ActiveSupport::Notifications myself, these two services kept appearing.
My examples below will use Librato since I found their service extremely simple to use. I was able to quickly get metrics submitted to them and viewable via their dashboard gauges. Librato also has a very nice presence on Github and some impressive tools for Ruby. Datadog is no slouch in any of these areas either. So please use what best fits your own needs.
IMPORTANT: The example Rails application code that follows makes direct use of the librato-metrics gem. This means that submissions will happen synchronously while your application is running. You would never do this in your Rails application! If you choose to use Librato, please use the librato-rails gem instead. Metrics are then delivered asynchronously behind the scenes so they won't affect the performance of your requests. Other possibilities would be to use background jobs or some other worker message queue.
Subscribing To Events
Assuming we have a Rails application that makes use of MiniMagick, Subexec or both, all we have to do now is bundle up our new notification gem along with librato-metrics.
# In Gemfile

gem 'subexec-notifications'
gem 'librato-metrics'
Now we need to subscribe to the subexec.run events that we instrumented in the subexec-notifications gem. For a Rails application, this is best done in an initializer named after the gem.
# In config/initializers/subexec_notifications.rb

ActiveSupport::Notifications.subscribe 'subexec.run' do |*args|
  Subscribers::SubexecLibrato.new(*args)
end
Publishing Metrics
As you can see in the code above, subscribing to an event will yield an array of arguments. Technically, these will be the name of the event, a few timestamps, a unique id, and the payload. Because dealing with individual arguments is not very object-oriented, I always recommend creating an event object using the ActiveSupport::Notifications::Event class. It consumes these arguments and gives you a clean interface to the duration of the event, payload, and more.
To accomplish this in one place for our publishing code, I created a simple base class for all our subscribers to inherit from. This base class creates our event object as well as a process method that subclasses must implement.
# In app/models/subscribers/base.rb

module Subscribers
  class Base

    attr_reader :event

    def initialize(*args)
      @event = ActiveSupport::Notifications::Event.new(*args)
      process
    end

    def process
      raise NotImplementedError
    end

  end
end
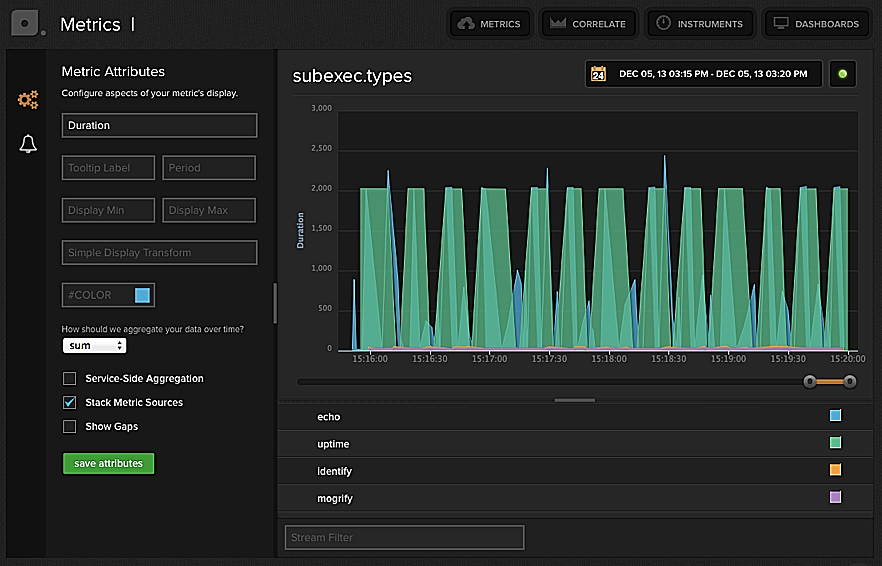
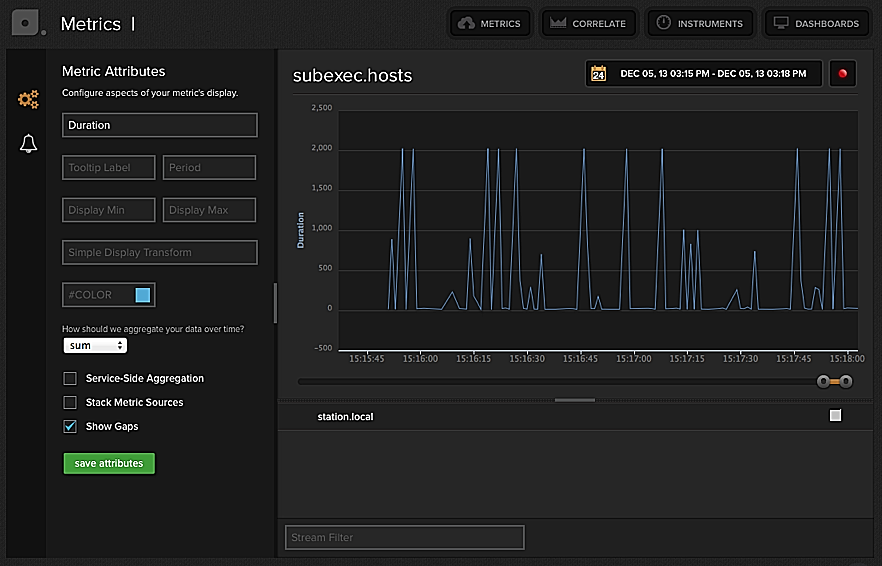
Now to the fun part, sending some metrics to Librato. Below is the full implementation of our SubexecLibrato event consumer. This creates two different types of metrics. One for each command/binary that was run and the other for the host the commands are run on. Each of these metrics will allow us to build some interesting gauges. The Librato site has a great developer section titled What Are Metrics that can guide you on what type of data you may want to submit.
# In app/models/subscribers/subexec_librato.rb

module Subscribers
  class SubexecLibrato < Base

    def process
      sub   = event.payload[:sub]
      dur   = event.duration
      type  = sub.command.split.first
      host  = event.payload[:hostname]
      time  = Time.current
      Librato::Metrics.submit 'subexec.hosts' => {measure_time: time, value: dur, source: host}
      Librato::Metrics.submit 'subexec.types' => {measure_time: time, value: dur, source: type}
    end

  end
end
Viewing Metrics
Here are what each of these metrics look like in Librato. To generate some commands, I wrote a small tests case that did some random MiniMagick commands along with a few echo and uptime commands. All of these ran on my local machine.


In Closing
Hopefully these simple examples we built will help get you excited both about instrumenting your application as well as collecting and viewing those metrics. If you are hungry for more, check out the links in the resources below. You can even dig deep into the Rails source to see where and how it uses ActiveSupport::Notifications. Thanks!